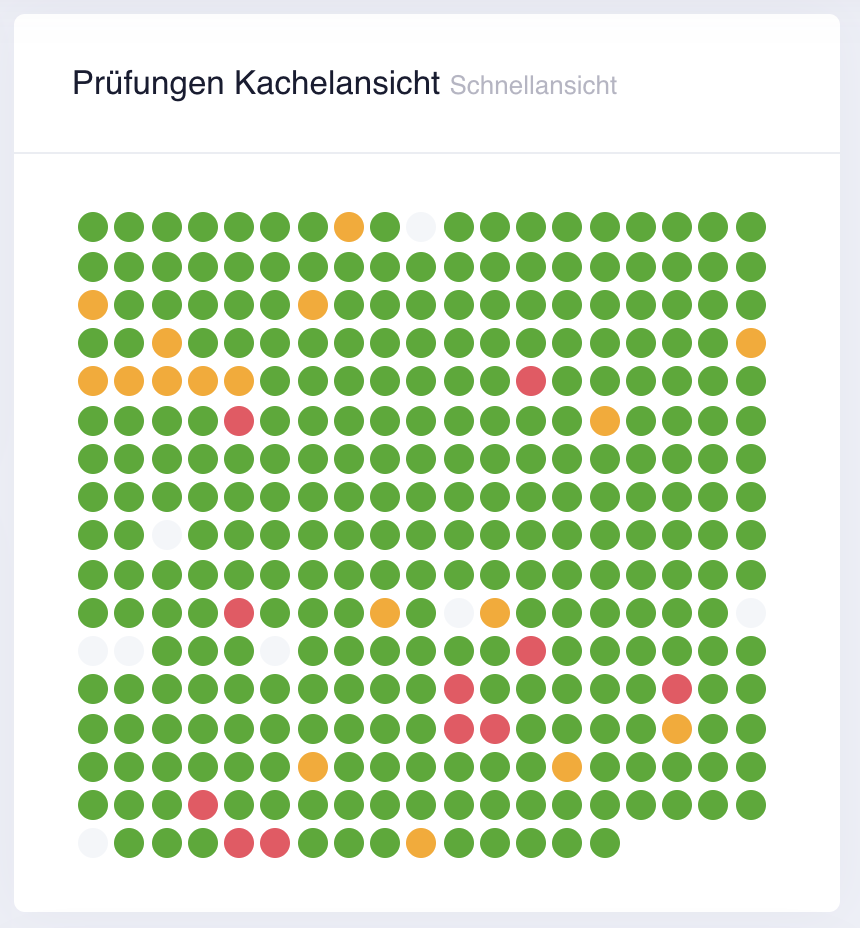
 Faster overview - we have for all users, who have configured 3 or more checks, added a quick view in tile format on the dashboard. So you can see at a glance the state of your infrastructure. Critical reviews are highlighted and you can click on the entry to go to the relevant review.
Here we answer questions about server monitoring from Livewatch. If you have a question that we have not yet answered here, please contact us.
In recent months, several critical security vulnerabilities have been discovered in server systems that can potentially have serious consequences for IT security. Some of the most significant vulnerabilities are presented below:
1. CVE-2024-37079: Security vulnerability in VMware vCenter Server
In June 2024, a critical vulnerability was identified in VMware vCenter Server. This vulnerability allows attackers to execute arbitrary code using manipulated packages, leading to a heap buffer overflow and endangering services. VMware has already released a patch that should be installed urgently.
2. CVE-2024-49113: LDAPNightmare in Windows servers
A recently discovered vulnerability in the Windows Lightweight Directory Access Protocol (LDAP) implementation, known as CVE-2024-49113, allows attackers to cause a denial-of-service (DoS) condition by crashing the Local Security Authority Subsystem Service (LSASS). Microsoft fixed this vulnerability in December 2024.
3. CVE-2024-20697: Vulnerability in Windows 11 and Server 2022
A vulnerability in Windows 11 and Windows Server 2022 allows attackers to execute arbitrary code when extracting RAR files. Microsoft fixed this vulnerability in January 2024 and recommends installing the patch and avoiding opening RAR files from unknown sources.
4. CVE-2024-21410: Critical vulnerabilities in Microsoft Exchange servers
The Federal Office for Information Security (BSI) reported in March 2024 that at least 17,000 instances of Microsoft Exchange servers in Germany are vulnerable to critical vulnerabilities. These gaps are already being actively exploited by cyber criminals. The BSI recommends using current versions of Exchange, installing available security updates and configuring the instances securely.
5. CVE-2024-49112: Zero-day vulnerability in Windows and Windows Server
A zero-day vulnerability in Windows and Windows Server enables denial-of-service attacks because it causes the operating system to crash. Windows 10, Windows 11 and Windows Server 2016, 2019 and 2022 are affected. Microsoft fixed this vulnerability in August 2024.
In today's digital world, a stable IT infrastructure is crucial. A failure of your website or server can cost customers and damage trust in your company. Livewatch.de offers you a professional monitoring solution that monitors your systems around the clock and alerts you immediately if there are any problems.
✅ 24/7 monitoring – your servers, websites and services are continuously checked. ✅ Immediate alarm – receive notifications by email, SMS or push message as soon as a problem occurs. ✅ Detailed analyses – use extensive reports and statistics to optimize performance. ✅ Globally distributed monitoring locations – your systems are tested from multiple locations to ensure global accessibility. ✅ Easy setup – Ready to go quickly, without complicated configuration.
With Livewatch.de you can minimize downtime and ensure optimal accessibility of your IT systems. Test our service today and secure reliable monitoring!
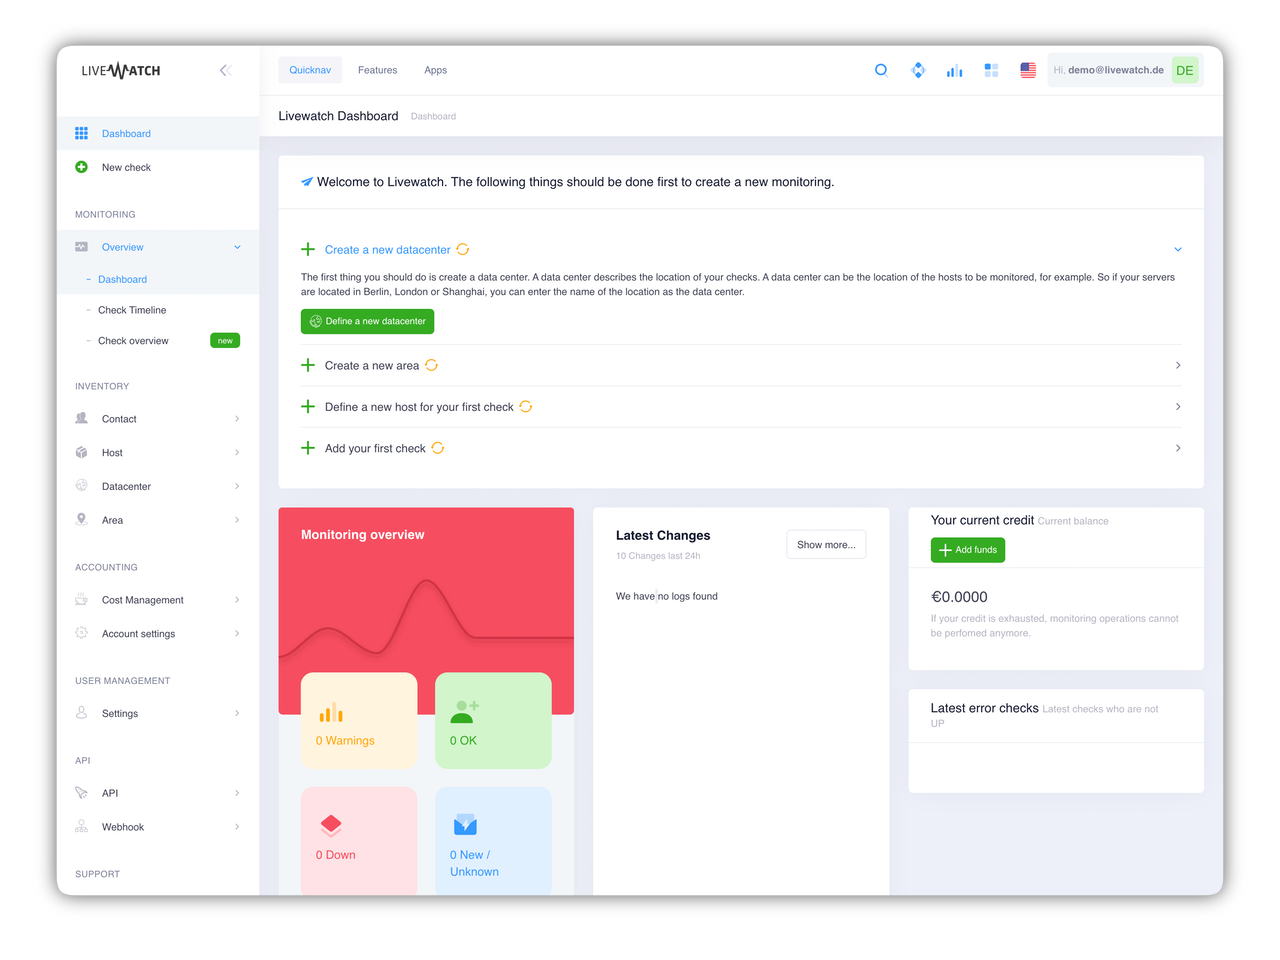
A dashboard is a graphical user interface that presents important information, data and metrics at a glance. It is used to visually present complex data sets and to display relevant information clearly. Dashboards are used in various contexts, from business management and data analysis to monitoring and reporting.
Here are some key features and functions of dashboards:
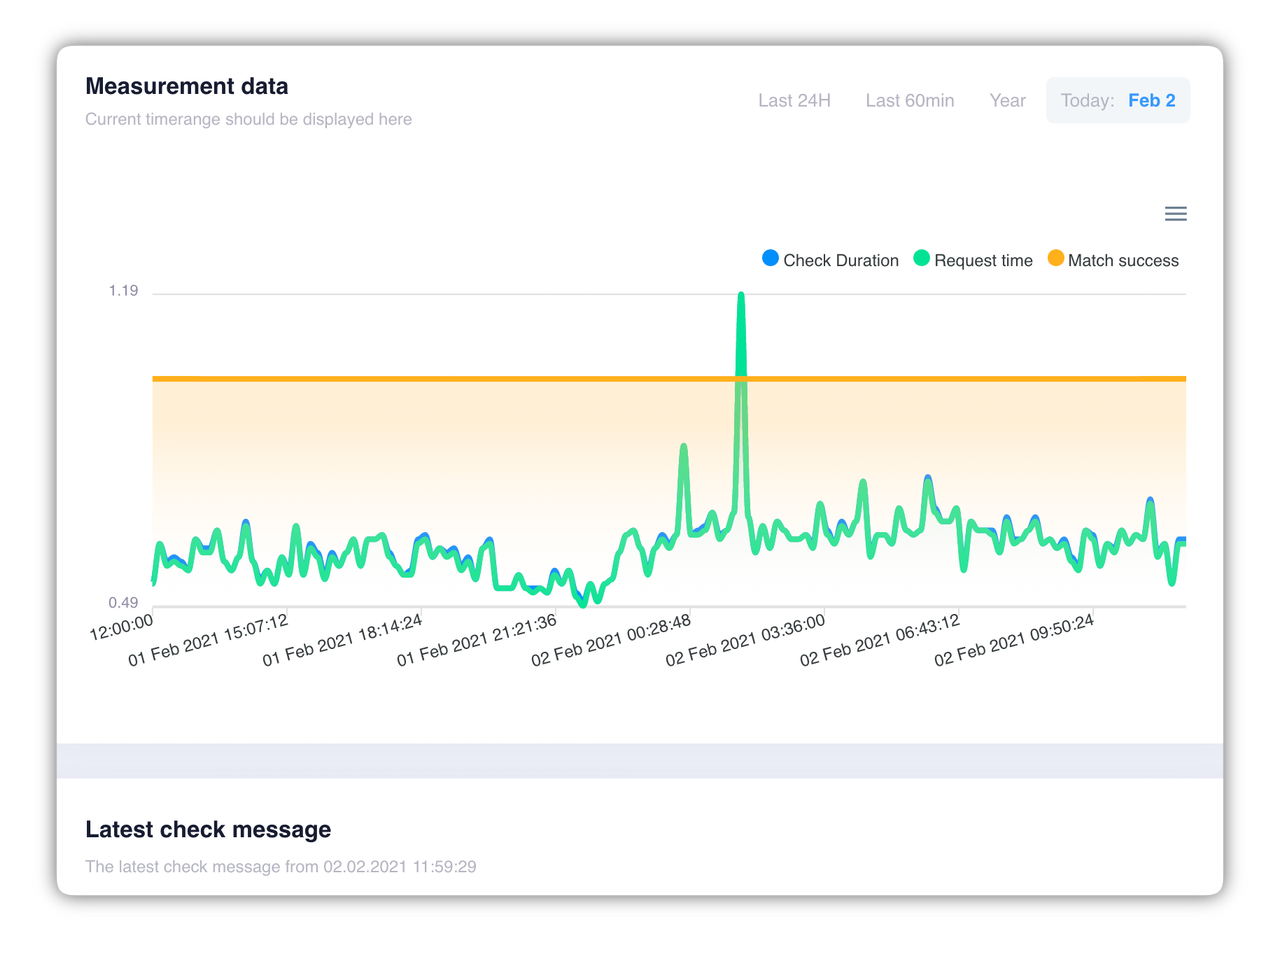
Data Visualization: Dashboards use graphs, charts, tables, and other visual elements to present data in an easy-to-understand manner. This makes interpretation and analysis easier.
Real-time data: In many cases, dashboards can display real-time data, meaning the information is continually updated to reflect current status or trends.
Customization: Users can often customize dashboards to their specific needs by adding or removing widgets, charts, or modules.
Merging different data sources: Dashboards can aggregate and merge data from different sources to create a comprehensive picture. This is particularly useful when information comes from different departments or systems.
Key Performance Indicators (KPIs): Dashboards often focus on displaying key metrics relevant to the business objective or use case. These can include revenue, conversion rates, user numbers, costs and more.
Interactivity: Many modern dashboards offer interactive features, such as the ability to navigate through different data slices, view details, or perform certain actions directly from the dashboard.
Targeted Applications: There are specialized dashboards for different use cases such as: B. Business intelligence dashboards, financial dashboards, marketing dashboards, IT monitoring dashboards and more.
Examples of dashboards can be found in various areas, such as: E.g.:
Corporate Governance: CEO dashboards that provide an overview of company performance.
Digital Marketing: Dashboards that display metrics such as website traffic, conversion rates and campaign success.
IT Monitoring: Dashboards showing network and server performance, error logs and system status.
Healthcare: Dashboards that visualize patient data, hospital utilization and medical metrics.
Dashboards play a critical role in simplifying data analysis and decision-making by presenting complex information in an easy-to-understand form.
Create, manage, analyze. No problem with our Livewatch Server Monitoring Control Panel. After registration you will get immediate access and you can start the server monitoring of your website.